

The most common figure in an AI business case is hours saved multiplied by an hourly rate. It is easy to calculate and easy to present, and it rarely appears in the accounts. In PwC's 29th Global CEO Survey, published in January 2026, 56 per cent of the 4,454 chief executives surveyed said they had seen no significant financial benefit from AI to date (PwC, 19 January 2026). Some of that gap is real underperformance. Some of it is measurement that was never set up to show anything.
Carbon is an AI transformation firm for Europe's real economy. We help mid-market businesses put AI to work. Carbon's position is that the return on an AI workflow can only be shown against a baseline fixed before anything is built, and that the result has to be split into what it actually is: time released, a realised change in cost, or additional capacity.
In brief
- Fix the baseline before the build, on measures the business already tracks, over a period long enough to show normal variation.
- Separate time released, realised cost change and additional capacity. Each needs different evidence, and only one of them is a cost change.
- Count the result net of review, rework, exceptions and running costs.
- Compare against what would have happened anyway, not only against the period before.
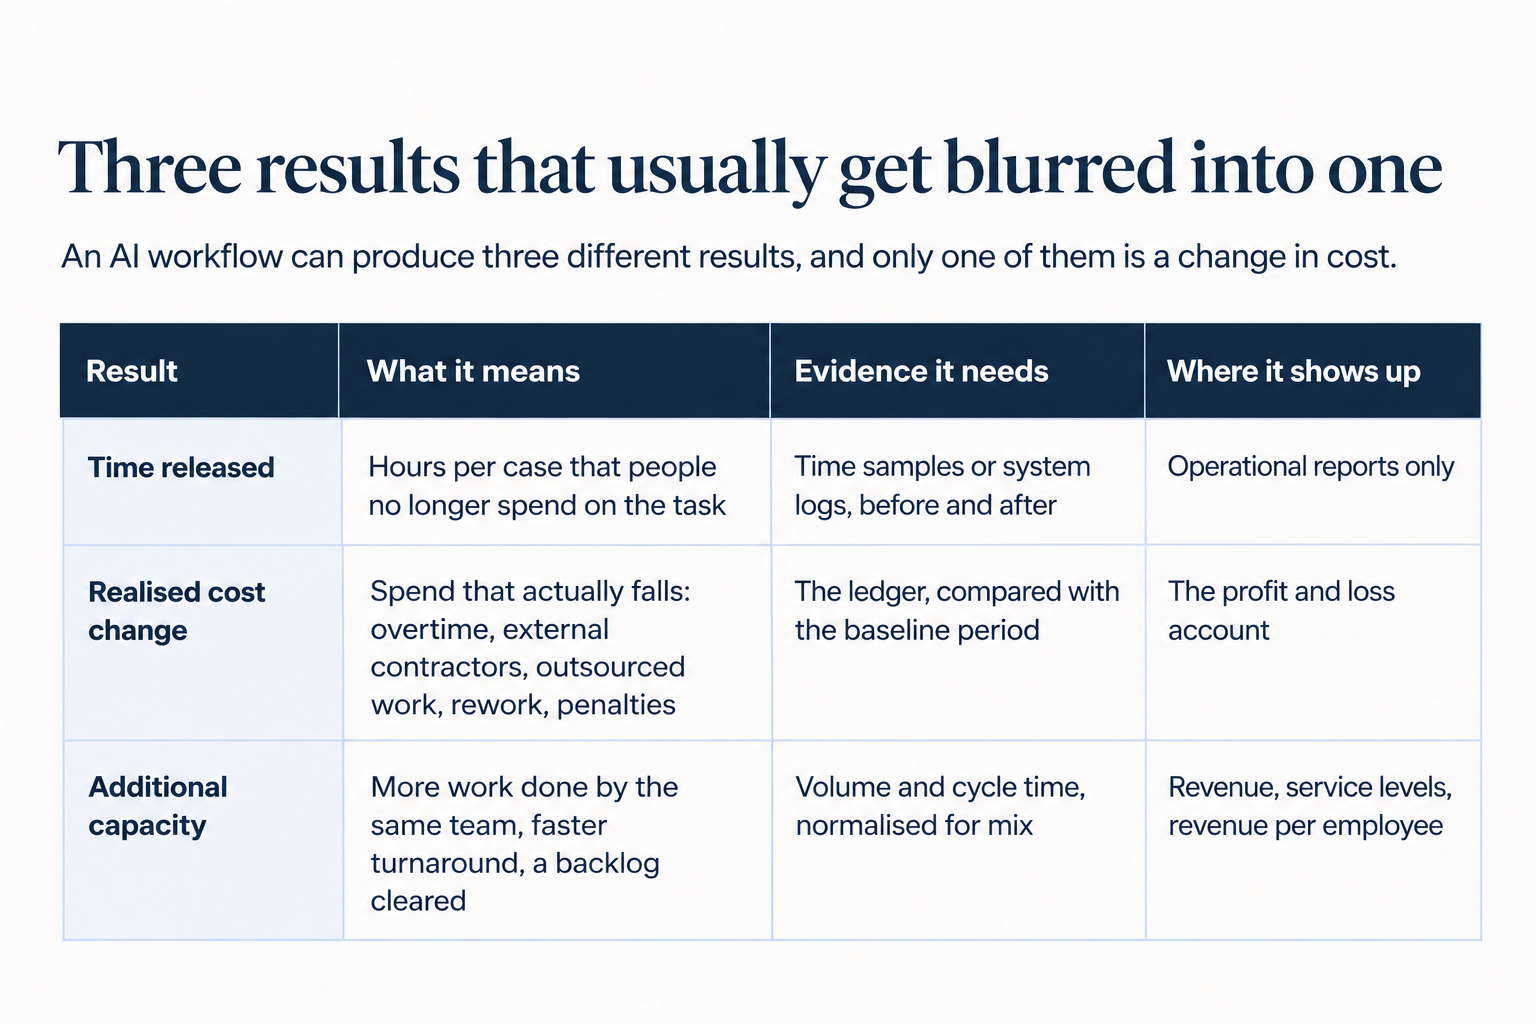
Time released is the result most business cases report, and on its own it is a measure of activity rather than value. It becomes value only when someone decides what the time is used for: taking on more cases, finishing work sooner, bringing outsourced work back in, or giving people the review and judgement work the AI cannot do. If nobody decides, the time is absorbed by other work and nothing changes in the accounts. Workday's January 2026 research found that companies were more likely to put AI savings back into technology (39 per cent) than into employee development (30 per cent), and that 32 per cent simply increased workload (Workday, 14 January 2026).
This is also where most AI business cases go wrong in the other direction, by converting released hours straight into salary savings. That conversion assumes people leave, which is neither the point of the work nor how the value is usually realised. In a services firm the larger gain is normally capacity: the same team handling more cases, or the same cases handled faster and with fewer errors. Measured that way, the result appears in revenue per employee and in cost as a percentage of revenue, which are numbers a finance team already reports.
The gap between task-level claims and aggregate results is wide. Researchers at the Federal Reserve Bank of St. Louis estimated from national survey data that generative AI users saved an average of 5.4 per cent of their work hours, about 2.2 hours in a 40-hour week, or 1.4 per cent of hours across all workers once non-users were included, and that this implied an increase of about 1.1 per cent in aggregate productivity (Bick, Blandin and Deming, St. Louis Fed, 27 February 2025). Released time is real. Its value depends on what happens next.
What to baseline before anything is built
Five measures cover most workflows: volume, cycle time, effort per case, quality and the current cost to serve.
- Volume: how many cases, documents or requests the workflow handles in a period, counted the way the business already counts them.
- Cycle time: how long a case takes from arrival to completion, including the time it waits.
- Effort per case: the hands-on time people spend on it, sampled from real work rather than estimated.
- Quality: error rates, rework, complaints or whatever the business uses to judge that the work was done properly.
- Cost to serve: the spend attached to the workflow today, including overtime, external help and the cost of errors.
The baseline period has to be long enough to include normal variation. A steady daily workflow can be baselined from a few weeks of sampled cases: in surveying, for example, two to four weeks of simple logging against the firm's own definition of a complete case file is usually enough to judge intake (AI for surveying firms). A month-end process needs at least one full cycle. Seasonal work needs a comparable period from a previous year, or the comparison will flatter whichever season the AI went live in.
Record the mix as well as the averages. If simple cases become a larger share of the work after go-live, every average improves without the workflow getting any better. In the Carbon method, the baseline is fixed in Discovery on a metric the business already tracks, before any design work starts (the Carbon method).
Count the costs that come with the workflow
The benefit of an AI workflow is the gross time or cost it removes, minus the review, rework, exceptions and running costs it adds.
The deductions are not small. Workday's survey of 3,200 employees, conducted in November 2025, found that nearly 40 per cent of AI time savings were lost to rework, including correcting errors, rewriting content and verifying outputs, and that only 14 per cent of employees consistently got clear, positive net outcomes from AI (Workday, 14 January 2026). A business case that counts the time saved on generating a draft but not the time spent checking it will overstate the result.
The costs to count fall into two groups. Recurring costs are human review per case, exception handling, rework when the output is wrong, and running costs: model usage, hosting, monitoring and the maintenance needed as models and connected systems change. One-off costs are the build itself, the change to how people work, and training. The recurring costs belong in every period's measurement. The one-off costs belong in the payback calculation.
The cleanest way to see the net effect early is to measure it directly on the same work. Carbon's three-arm parallel test runs real cases three ways, by people unassisted, by people with an AI copilot and by a standalone AI agent, and compares hours, error rates, exceptions and how often a person overrides the AI. That gives a net comparison, review effort included, before anything goes into production.
Compare against what would have happened anyway
A before-and-after comparison credits the AI with everything that changed in the period, including changes it had nothing to do with.
Volumes rise and fall, case mix shifts, a process is changed for unrelated reasons, a new hire settles in. Public-sector appraisal has a precise vocabulary for this problem. HM Treasury's Green Book defines business as usual as "the outcome that is expected if current arrangements continue and the proposal under consideration is not implemented", separates deadweight, the outcomes "that would have taken place without any intervention", from additionality, the outcomes "that take place as a result of the intervention", and tells practitioners to adjust explicitly for optimism bias (HM Treasury, The Green Book 2026). The same discipline applies to one AI workflow.
In practice that means three adjustments. Measure per case or per unit of volume rather than in totals, so a busy month does not look like an improvement. Compare like with like on mix, by tracking simple and complex cases separately. And treat quality as a guardrail: throughput only counts if the error rate held, because a workflow that runs faster and produces more rework has moved cost rather than removed it.
In a larger organisation the same workflow may run across several teams with different volumes and starting points. The baseline then has to be normalised by team before the results are combined, or the team with the most room to improve will make the whole function look better than it is.
When to measure, and how often
Take the reading once the workflow has reached a steady state, not in its first weeks. Performance usually dips while the work is reorganised around a new system, which means an early reading understates the result and can lead a business to stop just before the gains arrive (the AI J-curve).
A practical cadence has three points. During the shadow run, when the new workflow processes real work alongside the existing process, review the measures weekly to catch problems with quality and exceptions. Take a formal reading at the end of Delivery: Carbon reports the agreed metric against the baseline at that point, with about 90 days as the planning expectation for a single workflow. After that, review monthly or quarterly against the same baseline, so the comparison does not drift as the business changes.
For a smaller firm this can fit on one page: five measures, the baseline figures, the current figures and a short note on anything unusual in the period, reviewed each month by the person who owns the workflow.
Where to start
Start with one workflow, the five measures, a baseline period that reflects how the work really varies, and a named owner who will decide what the released time is used for. That last decision is the one most measurement plans leave out, and it is the one that decides whether the hours saved ever become a number in the accounts.
Carbon is an AI transformation firm for Europe’s real economy. We transform operations for mid-market businesses and automate recurring workflows for regulated services firms, measured against a baseline the business already tracks.
Own the Build™