


Back to all articles
The Operating Model Thesis
8
min to read
The AI J-Curve: Why AI Investments Dip Before They Pay Off
AI productivity dips before it rises. Why the AI J-curve is predictable, why business cases skip it, and how to plan for the dip.

Most AI business cases are drawn as a straight line. Spend goes in, gains follow within a few quarters, and the line keeps climbing. That line rarely survives contact with a live business.
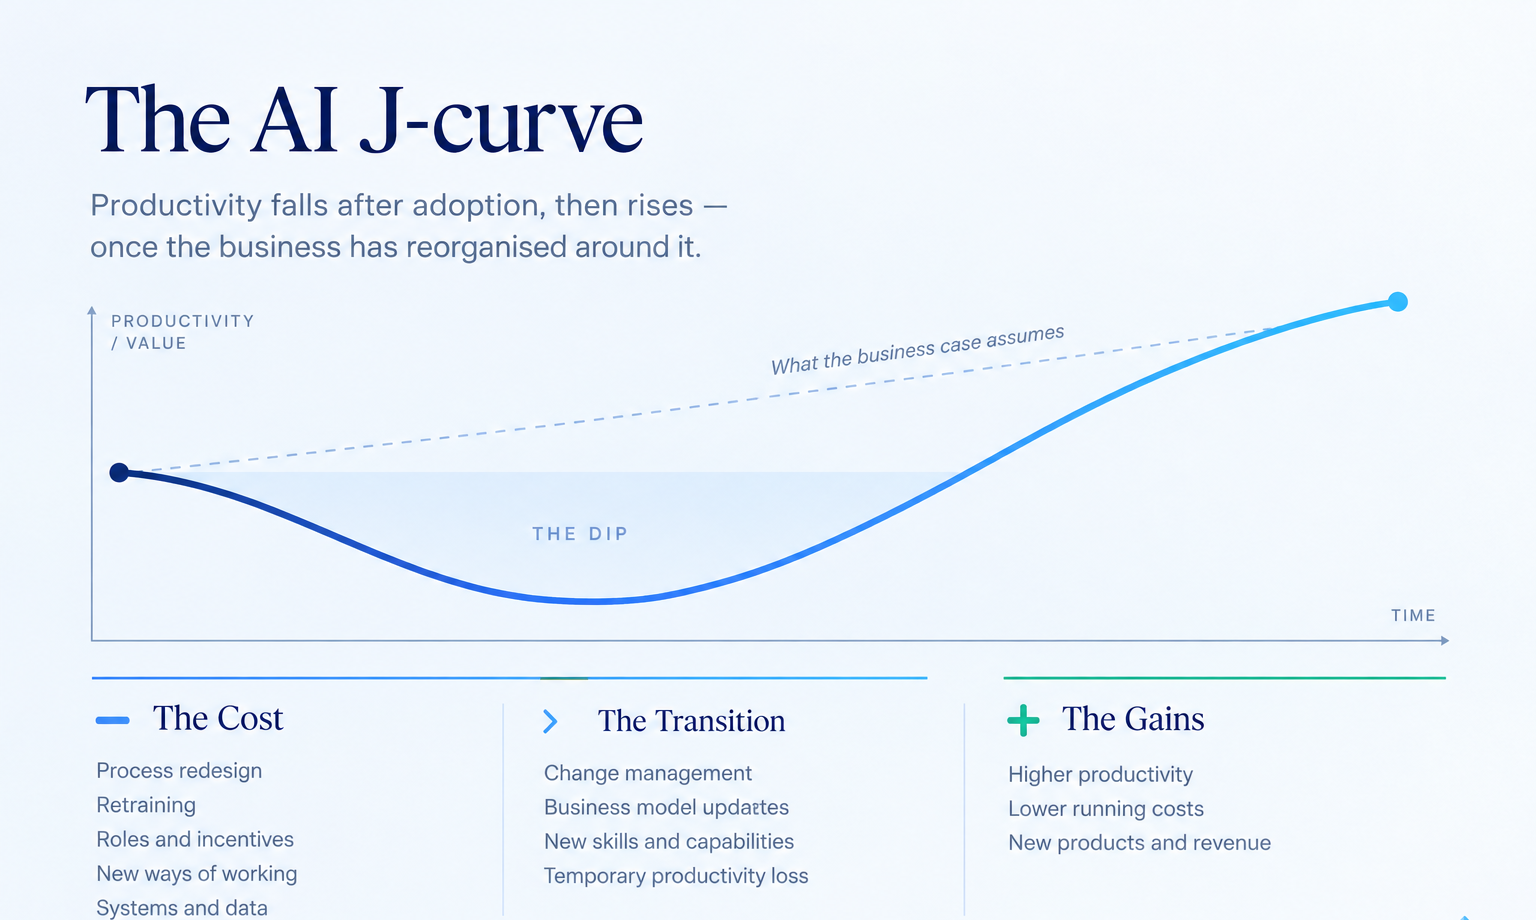
What happens instead is a dip. Performance falls while the work is reorganized around the new system, and it rises only once that reorganization holds. Leaders who signed off on the straight line see the dip, conclude that AI does not work in their business, and stop funding it close to the point where the curve would have turned.
The dip is predictable, and a predictable cost can be planned for. Most stalled AI initiatives are a planning failure. The technology usually did what it was built to do. The business case never accounted for what the business had to change around it.
What the AI J-curve is
The AI J-curve is the pattern in which productivity falls after a company adopts AI, then rises above its starting point once the work around the technology has been reorganized.
The term comes from economists Erik Brynjolfsson, Daniel Rock and Chad Syverson. In "The Productivity J-Curve," published in the American Economic Journal: Macroeconomics in January 2021, they argue that general purpose technologies such as AI require large complementary investments: new processes, new skills, new business models. Those investments are mostly intangible and poorly measured. Early on, productivity looks worse than it is. Later, when those investments pay off, it looks better.
The pattern now shows up in firm-level data. A 2025 US Census Bureau working paper by Kristina McElheran, Mu-Jeung Yang, Zachary Kroff and Brynjolfsson studied tens of thousands of US manufacturers and found that productivity losses came before gains after firms adopted AI. The losses were heaviest in older, established firms. In those firms, roughly a third of the loss traced back to one source: abandoning structured management practices during the change.
Part of the dip is the technology settling in. Part of it is discipline slipping while it does.
The J-curve is also the clearest explanation for the AI productivity paradox: heavy investment in AI alongside little measurable change in output.
The same curve appears with every general purpose technology
The timeline changes with each technology. The shape does not.
Electricity, 1890s to 1920s. Factories first replaced steam engines with electric dynamos and kept everything else, including the central shafts and belts that drove every machine at once. Economic historian Paul David, in "The Dynamo and the Computer" (American Economic Review, 1990), showed that the gains arrived only when plants were redesigned around individual motors, with production laid out around the flow of materials. US manufacturing productivity jumped in the 1920s, roughly four decades after commercial electricity arrived.
Computers, 1980s to 1990s. In 1987, Robert Solow wrote in the New York Times Book Review: "You can see the computer age everywhere but in the productivity statistics." The productivity paradox held until companies reorganized work around the machines instead of adding them to the old workflow.
ERP, 1990s to 2000s. Most enterprise leaders have lived through the go-live dip. Andrew McAfee's 2002 study in Production and Operations Management found that operational performance fell after enterprise systems went live, and that companies were unprepared for the "shakedown" period before normal operations returned.
AI, now. An NBER working paper published in February 2026 surveyed around 6,000 executives in the US, UK, Germany and Australia. Sixty-nine percent of firms reported actively using AI. Nine in ten reported no impact on productivity or employment over the previous three years. Most firms are in the dip, and most of their business cases did not plan for it.
What sits inside the dip
The dip is the cost of five kinds of work that every AI initiative needs and most business cases leave out.
Process redesign. A workflow built around human handoffs has to be rebuilt around the new system. Adding AI to the old process recreates the 1900 factory: a new power source driving the old layout.
Retraining. People learn a new way to do the work, and a new skill alongside it: judging when the system's output is right and when to overrule it.
Roles and incentives. Decision rights, review steps and targets change. People stay at the center of the work. What changes is what their roles contain, and the measures they are held to have to change with them, or the old incentives pull the work back to the old process.
Data work. The data the workflow depends on has to be found, fixed, connected and governed. Most of it was collected for reporting, not for a system that reads it in real time.
The temporary performance drop. While old habits and new ones overlap, output falls. A team running the old process and the new one side by side for a month does more work for the same result, before it does less.
None of this appears on a vendor quote. All of it is real cost.
Why AI business cases leave the dip out
AI business cases leave out the dip because its costs sit in operating budgets, spread across teams, while the costs that get counted are licenses and build time.
The reorganization is harder to price: hours spent redesigning a process, managers running two ways of working at once, a quarter of lower throughput in one function. Nobody owns those costs in the plan, so the plan assumes they are zero. When they arrive, they look like failure.
The industry data reflects the pattern. S&P Global Market Intelligence's survey of more than 1,000 companies in North America and Europe, published in March 2025, found that 42 percent had abandoned most of their AI initiatives, up from 17 percent a year earlier, and that companies scrapped an average of 46 percent of proofs of concept before production. Gartner predicted in July 2024 that at least 30 percent of generative AI projects would be abandoned after proof of concept by the end of 2025, citing poor data quality, inadequate risk controls, escalating costs and unclear business value. MIT's Project NANDA reported in July 2025 that 95 percent of the organizations it studied saw no measurable return from generative AI, and traced much of the gap to poor fit with daily workflows. The sample was small, but the diagnosis matches the J-curve.
The second cost is harder to see. A board that watched one AI initiative stall in the dip funds the next one less readily, or not at all. Confidence lost in a dip nobody planned for is slow to rebuild.
How to plan for the dip
A business case that budgets for the dip fixes the baseline, the gates and the date the result will be reported, before anything is built.
This is how Carbon structures an AI engagement, and it suits any company whose earlier AI work stalled.
Set an objective baseline first. Measure the workflow as it runs today: hours, error rates, exceptions, cost per transaction. Without a baseline, the dip cannot be told apart from failure, and the gains cannot be proven. Carbon's Audit-First Doctrine explains why this measurement comes before any design.
Work in gated stages with sign-off. Scope, discovery and definition, delivery, and an optional run stage. Each stage ends with a sign-off, and the business can stop at any gate. Leadership expects the dip and inspects it at each gate, instead of discovering it in a quarterly review.
Run the three-arm parallel test. During discovery, the same real work runs three ways: people unassisted, people with an AI copilot, and a standalone AI agent. The arms are compared on hours, error rates, exceptions and how often people overrule the AI. The result is objective evidence of what stays human, what is augmented and what can run on its own, before the build commits to a design.
Put one workflow into production in about 90 days. One workflow, live, keeps the dip short and visible. Ten parallel experiments spread the dip across ten teams and leave nothing in production.
Run champions and role redesign alongside the build. Adoption work that starts after go-live adds a second dip on top of the first. Champions inside the team and redesigned roles, built in parallel, mean people are ready for the system when it is ready for them.
Report the metric at day 90. Against the baseline, in a metric the business already tracks, whatever it shows.
The dip moves from a surprise into the plan, parallel adoption work makes it shorter, and leadership gets a dated decision point backed by evidence.
Where to start
Pick one workflow. Measure it as it runs today, agree the metric that will be reported at day 90, and get sign-off on both before anything gets built. When the curve turns, the business owns the system and the evidence for what it delivered.
Budget the dip. Measure the climb.

Carbon builds nearshore engineering Hubs and embeds AI capability inside client operations, for scaling technology companies and PE-backed organizations. Operational infrastructure, built to last.
Own the Build™


Own the build.
Start with a conversation.
Get in touch

What to read next


Own the build. Start with a conversation.
Get in touch

Own the Build™